Developer experience is one of the most important things to track for good engineering performance. The tricky part is that DevEx is overwhelmingly qualitative: good DevEx generally translates to your developers feeling enabled and free of frustrations.
Since DevEx has such a broad scope (read: just about everything that your devs touch), it can be hard to narrow this down to a few key metrics. We’ve looked at how other teams have tracked DevEx, and found a few ways to measure it from the ground up.
Why measure developer experience (DevEx)?
Developer experience is arguably one of the most important engineering metrics. Low engineering velocity or unreliable deployments can be blamed on poor processes or a bad codebase — they don’t necessarily boil down to your engineers underperforming, and therefore aren’t the best way to measure developer performance. Developer productivity is a good metric that takes both qualitative and quantitative data, but often misses some context when it comes to actual developer workflows.
In short, DevEx is important to measure because it reflects the key aspects of a dev’s quality of life: their fulfillment, their frustration, their productivity, and their output.
Metrics for developer experience
As the authors of SPACE metrics explain: you need more than one metric or metric system to accurately capture your team’s developer experience. Picking a base system (like SPACE or the DevEx framework) can give you a big-picture idea, and you can use smaller, supplemental metrics to give extra context. Here are a few metrics that we’ve found useful:
SPACE metrics
Since 2021, SPACE metrics have been one of the leading ways to measure developer productivity. They take into account five distinct dimensions of developer life, which when analyzed together, help you understand your devs’ overall work satisfaction and performance. SPACE recognizes that productivity goes beyond output alone. It also includes quality of life assessments, which are important for sustaining productivity. Here’s what the acronym includes:
- Satisfaction and well-being: how content developers feel with their day-to-day
- Performance: how reliable the code produced by the team is — lack of bugs, outages, etc.
- Activity: sum of outputs (e.g. commits, deployments, lines of code) over a measured period of time
- Communication and collaboration: how effectively teams work together
- Efficiency and flow: how able a dev is to work for a long period of time uninterrupted
Overall, SPACE metrics are excellent for DevEx because they’re quite holistic. DevEx requires measuring culture, in addition to concrete engineering stats (e.g. number of deployments and commits), and SPACE keeps a good balance of both.
DevEx framework
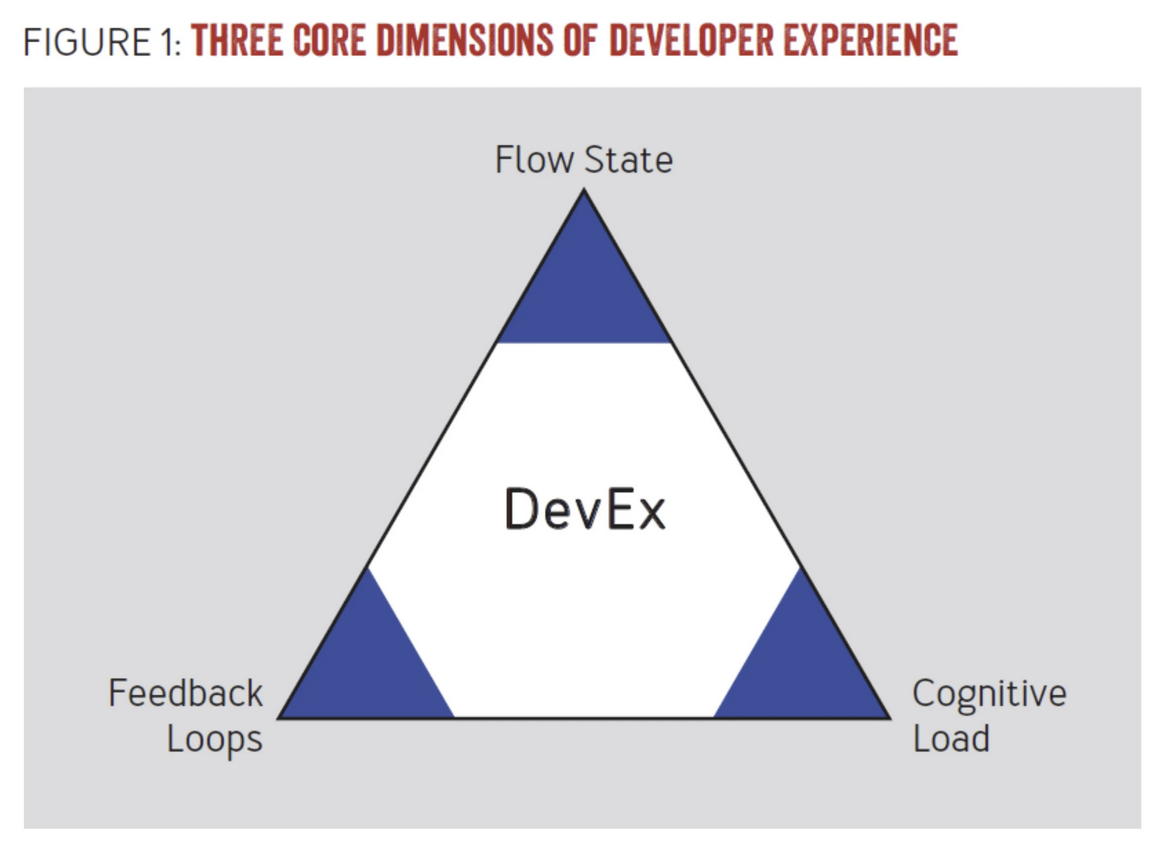
The DevEx framework measures developer experience by breaking it down into three pillars: flow state, feedback loops, and cognitive load. Of all the measurements on this list, the DevEx framework is the most specialized to measuring DevEx overall. It provides guidelines for designing developer experience KPIs, particularly when it comes to “qualitative” things like perceptions.
Because developer experience has such a wide scope, breaking it down into just three silos is more helpful than studying a bunch of smaller facets together. For example, it’s harder to make sense when taking a handful of standalone metrics (e.g. deployment data, test coverage), and trying to puzzle out whether they suffer from bad DevEx or something else entirely.
The DevEx framework suggests collecting data directly from your developers by creating surveys for them. You can then track their perceived productivity, burnout, and flow and how it changes over time. Furthermore, the DevEx framework reminds teams that often the best way to solve for DevEx is simply asking your developers what they need.
Lead time for changes
Change lead time is one of the four key DORA metrics. It measures how long it takes for code committed to hit production. Usually, this is more of a measure of your pipeline quality, but it can also show you how strong your main “feedback loop” is.
This is a really straightforward metric to measure (subtract deploy timestamps from commit timestamps, and find the average), and can tell you a lot about your outer loop.
Deployment frequency
Chances are, if you have good DevEx, your engineers will be shipping code pretty frequently. Conversely, it’ll be really hard to see good deployment frequency if your DevEx is suffering. Deployment frequency is also one of the four key DORA metrics. It’ll give you a sense of your team’s engineering velocity. This is also something you’ll use to get current performance relative to your team’s historical performance: maybe there are some recent dips, and maybe they can be attributed to a culture or tooling regression.
Time to first commit
This metric is generally used to measure how long it takes to onboard new engineers. However, the time it takes to onboard often reflects the complexity of your codebase. If it’s taking over a couple weeks for new devs to start committing, your codebase probably takes awhile to grasp. This might be a combination of tech debt and dense documentation. A more complex codebase increases developer cognitive load: simple tasks become unnecessarily complicated and frustrating. Understandably, cognitive load has a negative effect on DevEx.
Obviously, time to first commit isn’t the only way to measure your codebase’s complexity, but it can give a good ballpark, and at the same time show you how your new hires are finding it with fresh eyes.
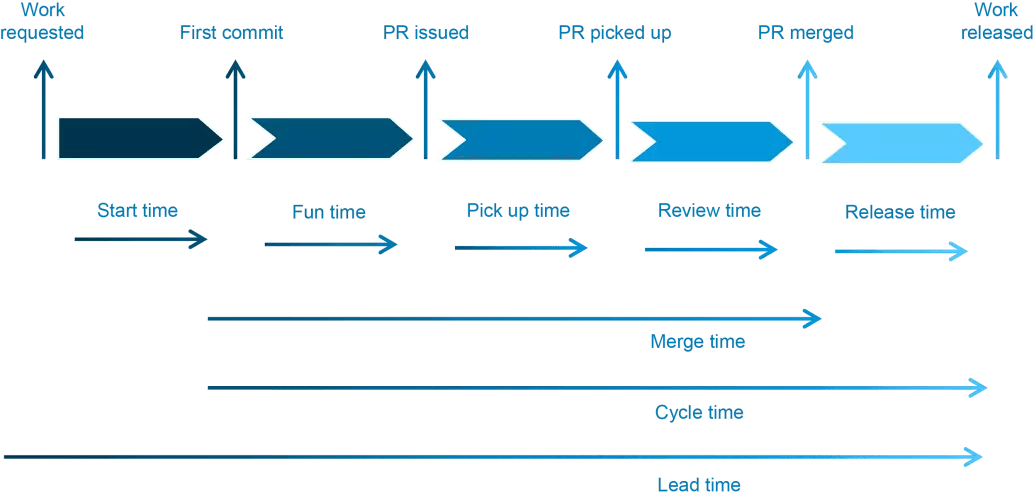
Cycle time
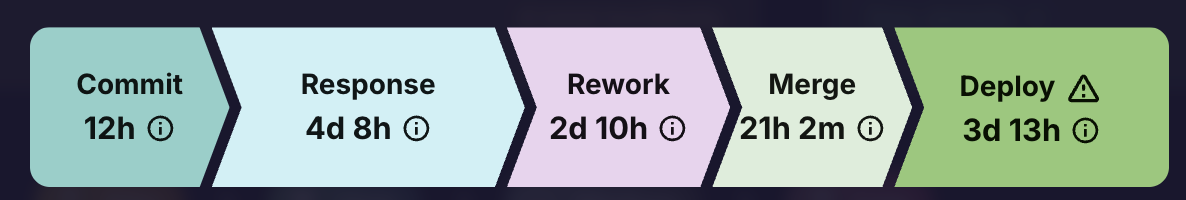
Cycle time is a measure of the total time it takes to complete a feature, from idea to production. This has a wider scope than lead time for changes, which only accounts for the post-development timeline. Cycle time is a good way to get a sense of the inner and outer dev loops, particularly when it comes to productivity. It’s pretty broad when considered alone, and is best broken down into smaller stages (planning, development, testing, review, deployment) to understand the bottlenecks.
Cycle time is an excellent metric for DevEx because it zooms out to capture every stage of the SDLC that a developer touches. This context can help you find out what needs improvement and where your focus should lie.
Looking beyond DevEx
Once you solve for DevEx, everything else will follow: your engineers will be happy and unblocked, so they’ll be able to ship more code. When they’re feeling fulfilled, they’re less likely to burn out — they can sustain their current velocity and keep writing high-quality software. And when your testing is solid, your docs are up-to-date, and your codebase is digestible, your team is able to work at their fullest capacity.
At Shipyard, DevEx is our North Star. We design our product so your team can iterate fast, get feedback, and keep building. Try Shipyard today and get full-stack environments on every PR/MR for testing, sharing, and previewing your features as you build them.